Chromatin accessibility maps of chronic lymphocytic leukemia identify subtype-specific epigenome signatures and associated transcription regulatory networks
Supplementary Website
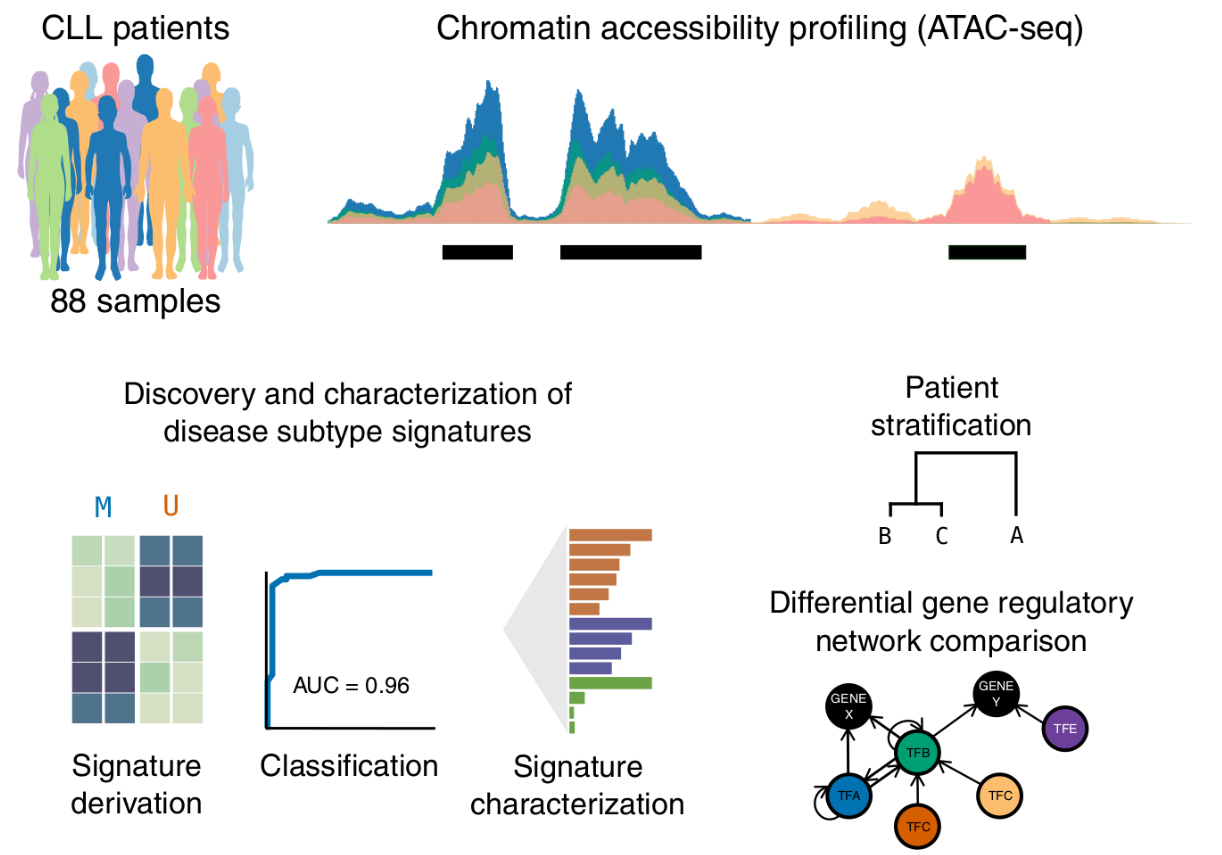
Study overview
Genome browser tracks
Data Visualization: Interactive browser tracks for the chromatin accessibility landscape of CLL All data are available for interactive browsing:
Data
Data Analysis: The CLL chromatin accessibility map and gene regulatory networks for download
Download the complete set of analysis outputs.
Software
To foster reproducibility and facilitate reuse, the source code underlying the analysis is contained in a Git repository at Github.
Citation
If you use these data in your research, please cite:
André F. Rendeiro*, Christian Schmidl*, Jonathan C. Strefford*, Renata Walewska, Zadie Davis, Matthias Farlik, David Oscier, Christoph Bock
Chromatin accessibility maps of chronic lymphocytic leukemia identify subtype-specific epigenome signatures and transcription regulatory networks.
Nat. Commun. 7:11938 doi: 10.1038/ncomms11938 (2016).
* These authors contributed equally to this work